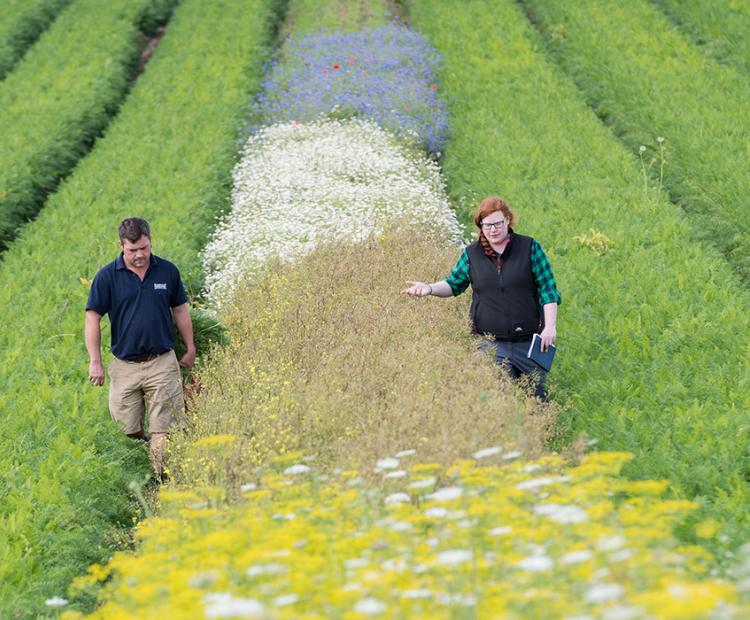
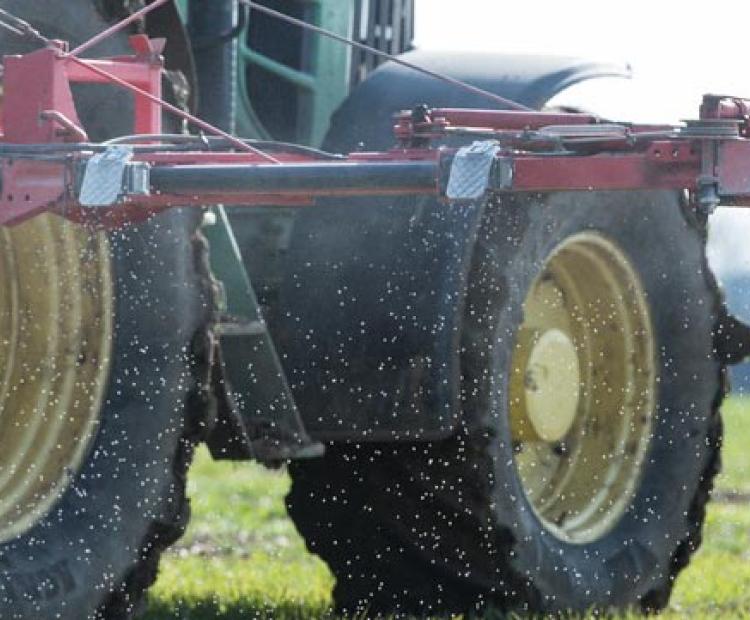
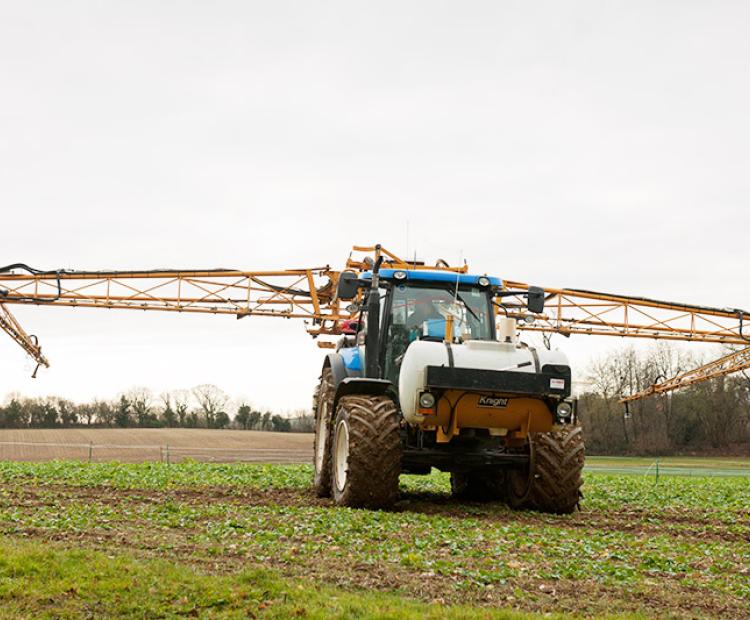
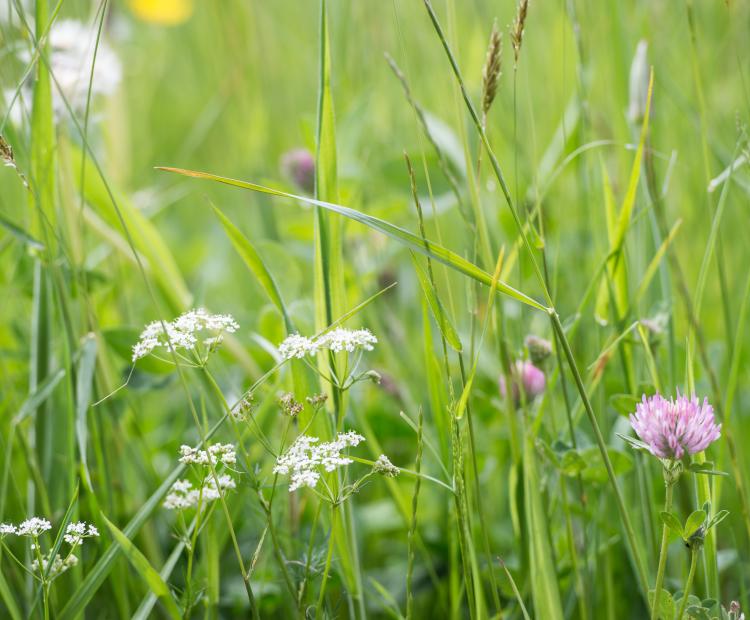
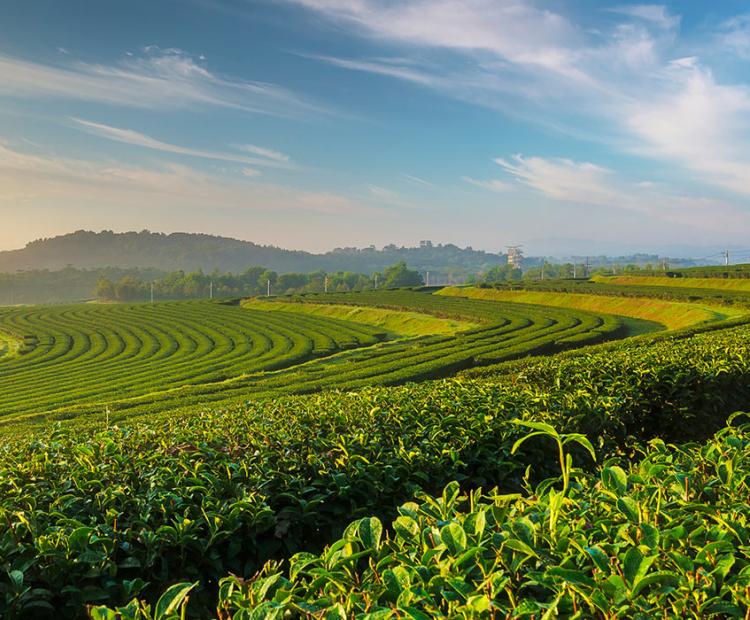
The big picture: using wildflower strips for pest control
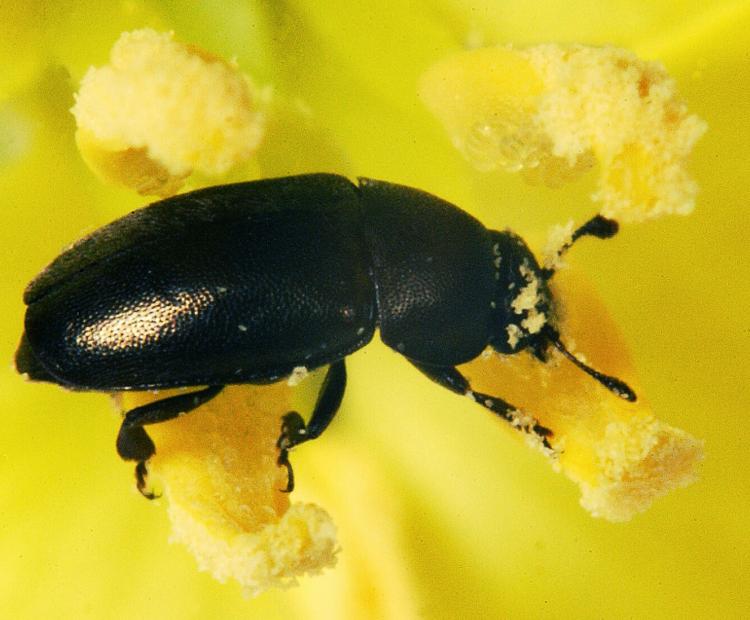
They may be beautiful, but these strips prove pretty deadly for every farmer's mortal enemy: aphids
Rothamsted Research consists of four sites located around England, comprising of two main campuses in Harpenden, Hertfordshire and North Wyke, Devon and two research farms at Woburn, Bedfordshire and Brooms Barn, Suffolk. The sites at Harpenden, Woburn and Brooms Barn have meteorological (Met) stations that have been measuring weather variables since 1853, 1928 and 1963 respectively. The daily observational data from these stations are available from the electronic- Rothamsted Archive (e-RA).
The Met Stations were serviced by a dedicated team of scientists and farm technicians until Dec 2003. They would go out daily at 09:00 GMT to measure temperature (air and soil), rainfall, drainage (Harpenden), wind speed and wind direction, seven days a week, three hundred and sixty-five (six) days a year. At the end of 2003 the Rothamsted Met Stations were fully automated with the manual equipment being replaced with a suite of electronic sensors and dataloggers with direct access from a personal computer. These automated sensors went live on 1st January 2004. The main change was replacing the standard five inch cylindrical rain gauge (Met Office type MK2) with an aerodynamic tipping bucket rain gauge (type ARG100) which had a unique design to reduce wind eddies and loss of water by minimising out-splash and evaporation resulting in higher rain water capture. The gauge we use today is a SBS500 (installed on 10/09/2020) which is similar in design to the outgoing ARG100.
In May 2017 the Met station at Harpenden was recognised as a long-term observing station by the World Meteorological Organisation (WMO) for more than 100 years of observations
The ECN Rothamsted automated weather station (ECN AWS T06 01) was established at the Harpenden campus in March 1993 as a stand-alone automated weather station adjacent to the main weather station. Meteorological Data from ECN AWS T06 01 is available as a cited dataset (1992 to 2015) from the Environmental Information Data Centre (EIDC). At the beginning of 2014 the decision was taken to decommission ECN AWS T06 01 and relocate to the existing Harpenden Met Station, where climatic variables have been measured since 1853. To make the Harpenden Met Station compatible with the outgoing ECN AWS additional instrumentation was installed. The new location has been designated ECN AWS T06 02.

Weekly, monthly and yearly summaries of weather data are graphed, using Genstat 23rd Edition software, every hour from hourly and daily data measured at the Harpenden, Woburn and Brooms Barn Meteorological Stations. Yearly summaries are graphed against the 30 year mean (1991-2020), with the variation of the daily values around their mean being shown using +/- one standard deviation.
These graphs are produced from the raw data and are subject to change after quality checks. At times of snowfall rainfall data will not be accurate and depending on rate of thaw may not be recorded on the day it occurred.
* Why use a 30 year mean? The following extract was taken from the Met Office web-pages explaining why the long-term mean is averaged over a period of thirty years - "The World Meteorological Organization (WMO) requires the calculation of averages for consecutive periods of 30 years, with the latest covering the 1961-1990 period. However, many WMO members, including the UK, update their averages at the completion of each decade. Thirty years was chosen as a period long enough to eliminate year-to-year variations." Therefore, unless stated, we use the most recent complete thirty year mean (1991 to 2020). (REVISED 18/01/2021 previously 1981-2010).
Mean Air Temperature (degrees Celsius, °C)
Mean Soil Temperature (degrees Celsius,°C)
Total Rainfall (millimeters,mm)
Mean Wind Speed (metres per second, m/s) and Direction (degrees, °)
Mean Relative Humidity (percent, %)

Temperature, °C:
last hour - red column (red value);
previous hour - green pointer;
maximum for day - orange pointer;
minimum for day - blue pointer.
Rainfall, mm:
hourly and total - blue column (blue value).
Wind Variables, m/s:
last hour - purple arrow (within title text);
previous hour - blue arrow
Hourly Mean (Monthly)
Daily Mean Maxmimum and Minimum (Monthly)
Daily Mean Maxmimum and Minimum (Annual)
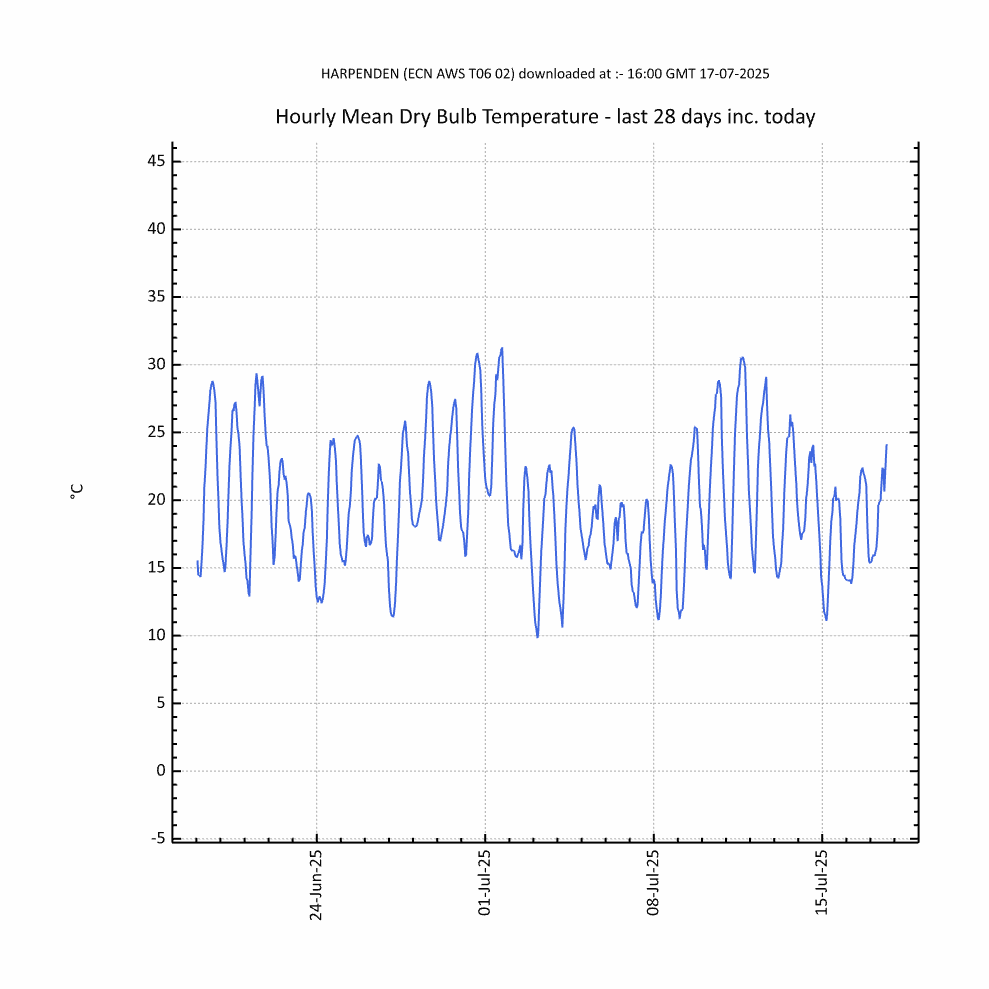
Monthly: Hourly mean air temperature, °C. (blue line) .
Monthly: Daily maximum air temperature (orange line) and minimum air temperature (blue line), °C, are based on hourly mean air temperatures (09:00 to 09:00).
Annual: orange Line (Maximum), blue Line (Minimum):Daily Values, °C; red Line: 30 year mean, 1991 to 2020; grey Line: +/- one standard deviation representing the variability of the data used to calculate the thirty year mean.
Hourly and Daily Total Rainfall (Monthly)
Daily and Cumulative Total Rainfall (Annual)
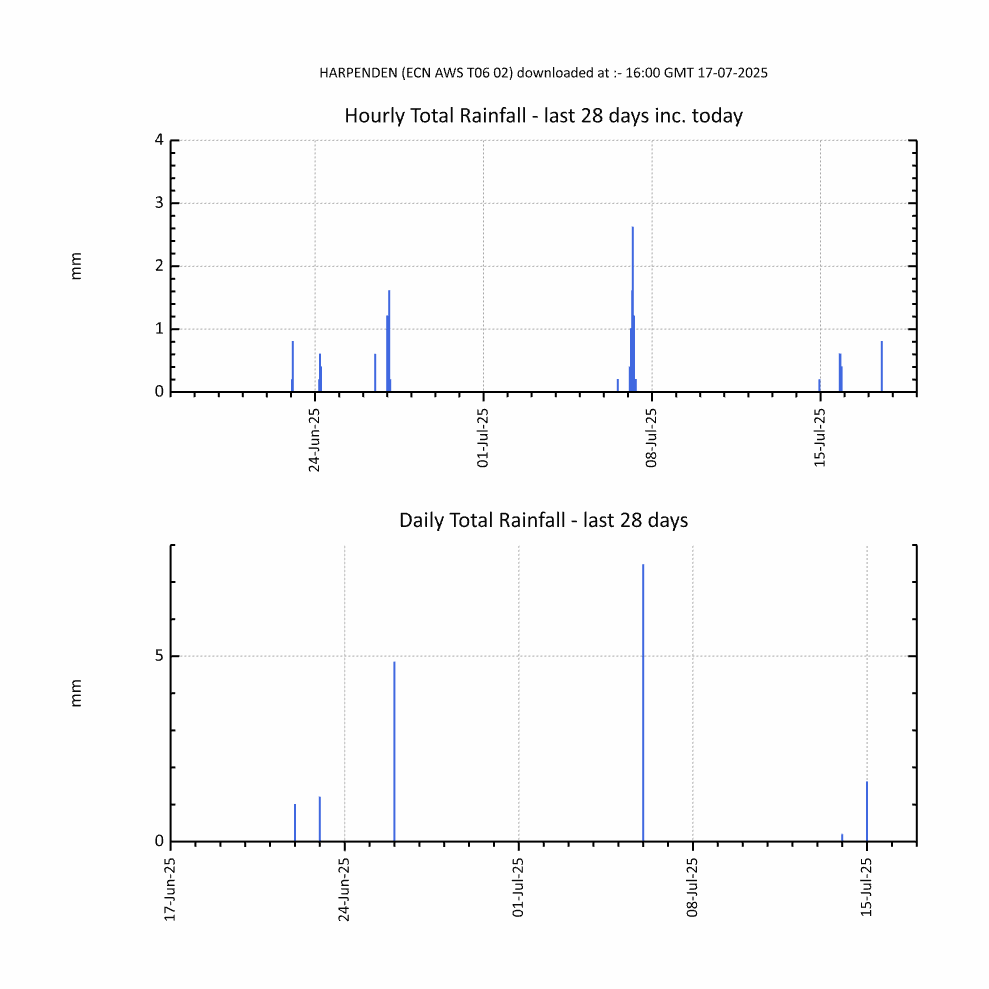
Monthly: Hourly data: total rainfall, mm, in an hour; Daily data: total rainfall, mm (09:00 to 09:00).
Yearly: blue line: Daily rainfall, mm (09:00 to 09:00) and Accumulated daily rainfall, mm ; * red line: accumulated daily rainfall, 30 year mean (1991 to 2020 previously 1981-2010); grey line: +/- one standard deviation representing the variability of the data used to calculate the thirty year mean.
* The thirty year mean (1991 to 2020) for rainfall should be used only for guidance. During this period rainfall was measured using the the two different styles of rain gauges as mentioned above.
Hourly Mean Wind Speed (metres per second, m/s)
Hourly Mean Wind Direction (degrees, °)
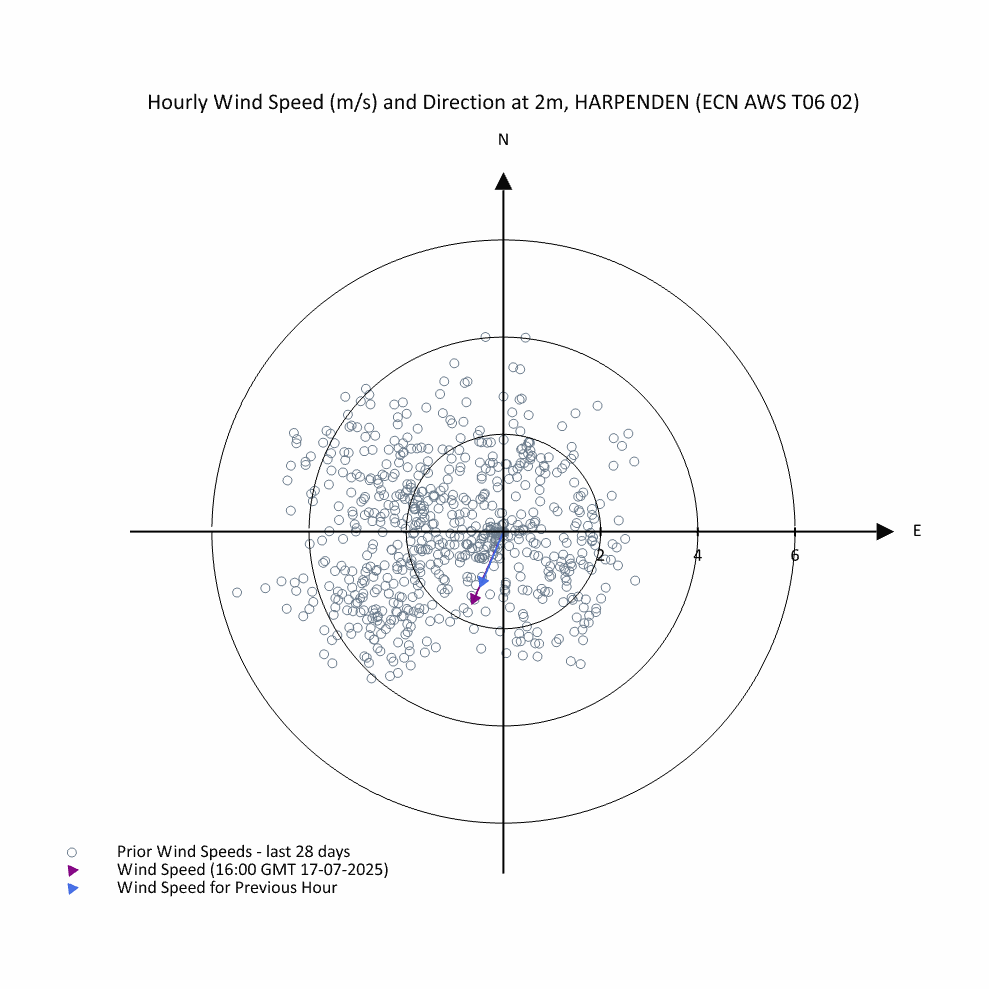
Monthly: For weekly and monthly charts of wind vectors the most recent and penultimate wind speed and direction records are indicated by the purple and blue arrows, respectively. The arrows indicate the direction (°) from which the wind comes from. Earlier records are displayed using open circles. Data points are the average wind speed (m/s) for a given direction (averaged) over a one-hour period. The x- and y- axes represent wind direction and the distance of each point from the origin represents wind speed (concentric circles denote the wind speed intervals, m/s).
Yearly: Annual wind data are summarised on a rose diagram showing the distribution of winds according to their speed (m/s) and direction (°). Wind records are grouped by direction into 22.5° circular segments each with radius (length) corresponding to the number of wind records in the segment (expressed as a percentage of the 365 daily observations represented). Wind speeds are categorised according to the 'Key' (lower right-hand scale) and the proportion of all records of each speed occurring within each segment are denoted using the appropriate colours.
Hourly Mean Solar Radiation (Monthly)
Daily Mean Solar radiation (Annual)
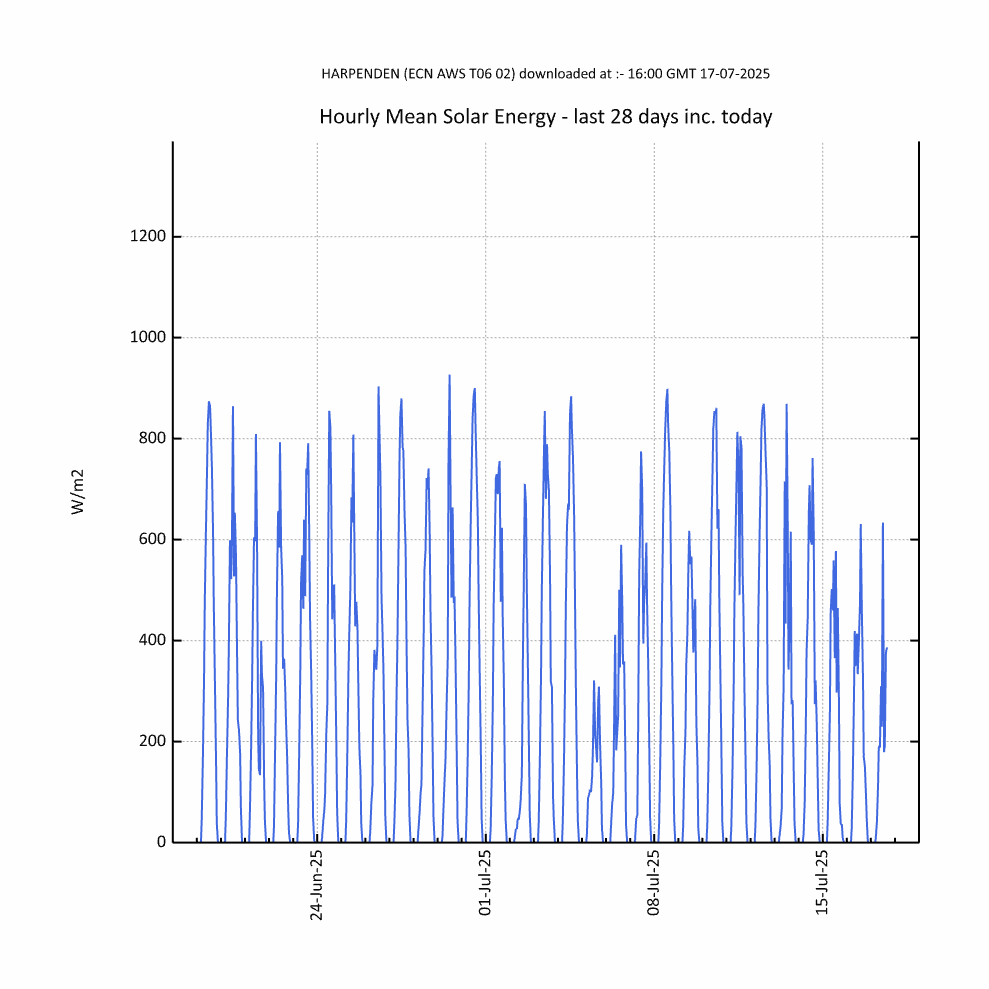
Monthly: blue line: hourly mean solar radiation, watts/m2.
Yearly: blue line: Mean Daily Values, watts/m2 (00:00 to 24:00 GMT); red line: 30 year mean, 1991 to 2020 (previously 1981-2010); grey line: +/- one standard deviation representing the variability of the data used to calculate the thirty year mean.
Hourly and Daily mean temperature under 10cm bare soil (Monthly and Annual)
Hourly and Daily mean temperature under 30cm grass (Monthly and Annual)

Monthly: blue line: hourly mean soil temperature.
Yearly: blue line: Daily Values; red line: 30 year mean, 1991 to 2020 (previously 1981-2020); grey line : +/- one standard deviation representing the variability of the data used to calculate the thirty year mean.
Harpenden (10cm Monthly, 10cm Annual, 30cm Monthly, 30cm Annual)
Woburn (10cm Monthly, 10cm Annual, 30cm Monthly, 30cm Annual)
Hourly and Daily mean temperature under 20cm bare soil (Monthly and Annual)

Monthly: blue line: hourly mean soil temperature.
Yearly: blue line: Daily Values; red line: 30 year mean, 1991 to 2020 (previously 1981-2020); grey line: +/- one standard deviation representing the variability of the data used to calculate the thirty year mean.


